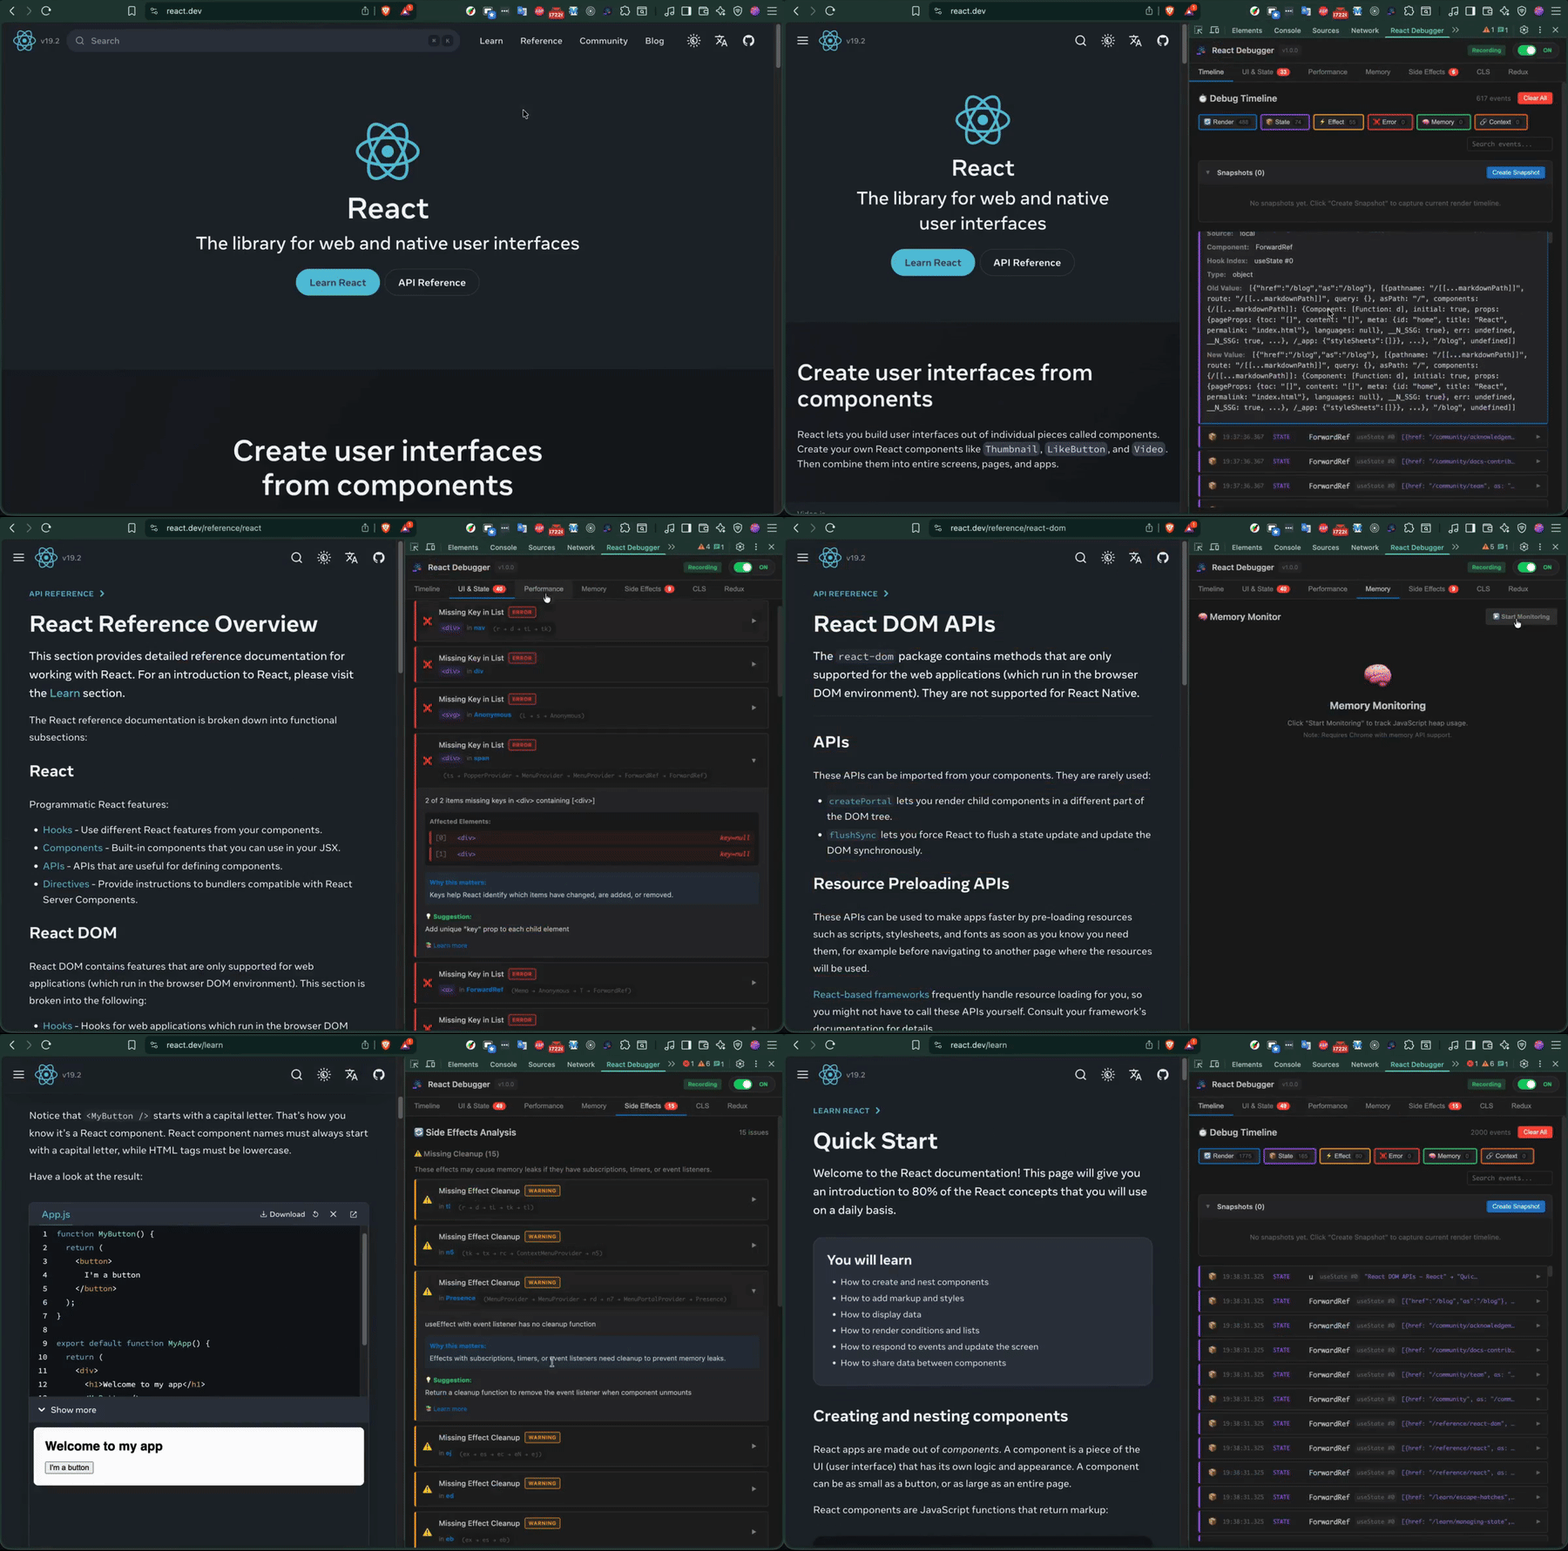
Advanced debugging and performance optimization tool for React applications. Detect issues, monitor performance, and debug Redux state—all in one extension.
Everything you need to debug and optimize your React applications
Severity KPIs, a render-pressure sparkline, top offenders at a glance, and page-load vitals — the first thing you see when you open the panel.
Memory heap-over-time and render-distribution charts, drawn with a custom ChartCanvas — no chart library dependencies.
View the Redux state tree, dispatch actions manually, and debug state changes as they happen.
Find missing cleanup functions, dependency issues, and stale-closure-async bugs in your useEffect hooks.
Catch unstable list keys, hydration mismatches, context cascades, and suspense waterfalls — plus stale-closure-async, inline-handler-cost, and ref-mutation-during-render.
Bring your own API key (BYOK) for any AI provider, connect the MCP server for LLM coding agents, and control anonymous telemetry — opt-in and off by default.
AI-powered code analysis detects security vulnerabilities, performance bottlenecks, and crash risks. 3 free analyses per session — unlimited with a subscription key or your own BYOK provider.
Get up and running in minutes
The fastest way to get started. Run a single command:
npx react-debugger
Then load the extension in Chrome:
chrome://extensions/Clone and build the extension yourself:
git clone https://github.com/hoainho/react-debugger-extension.git
cd react-debugger-extension
npm install
npm run build
Then load the dist folder in Chrome using the same steps above.
Open DevTools on any React application and find the "React Debugger" tab — now a focused 5-view panel: Dashboard, Profiler, State, Effects, and Settings.
React Debugger is open source and welcomes contributions. Report bugs, suggest features, or submit pull requests.